Woodland Power Data Integration
Utility Data Pipeline
Client: Woodland Development Corp
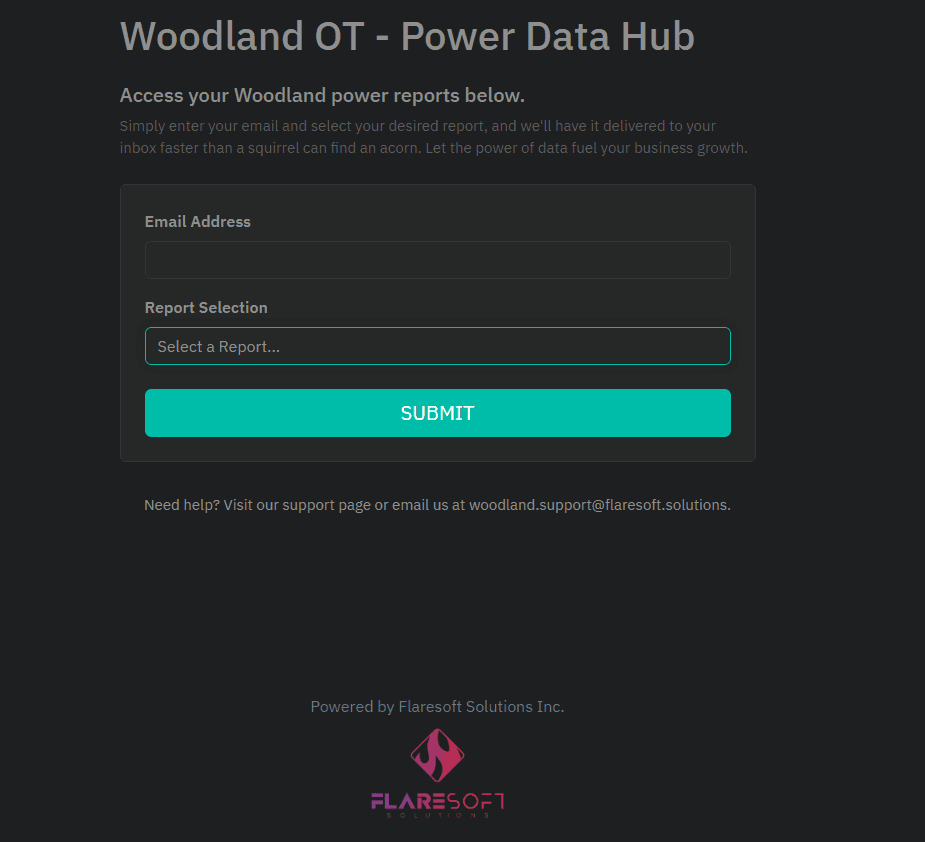
Self-serve reporting portal with email delivery
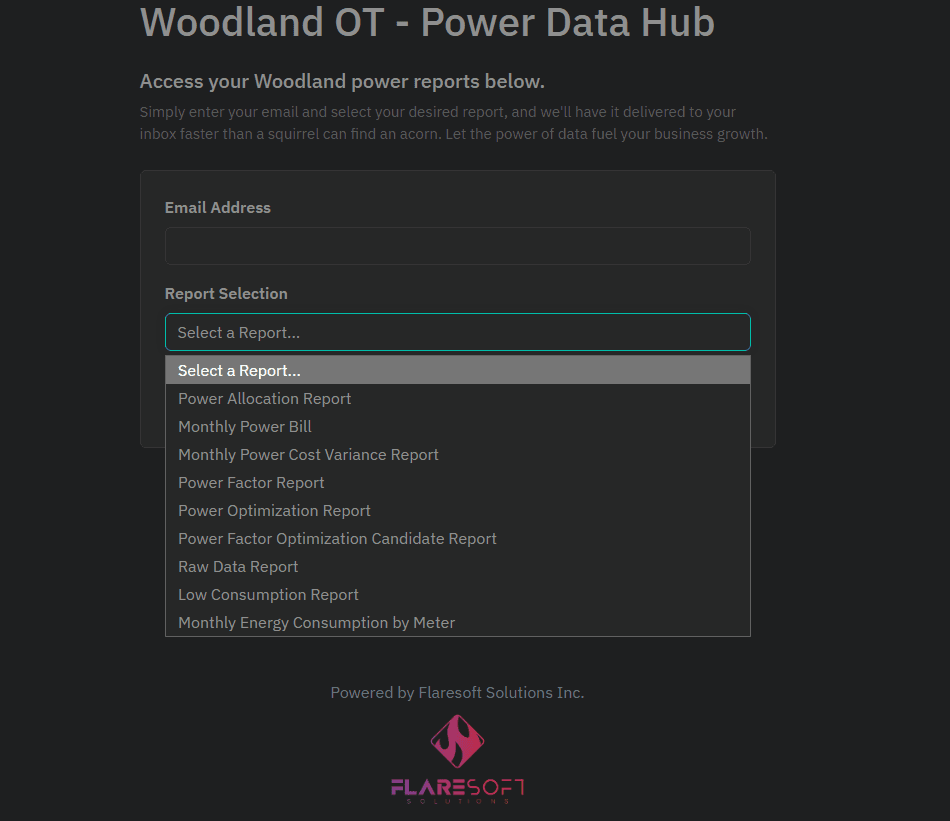
9 different report types covering consumption, billing, and optimization
The Challenge
The client's power consumption data — critical for managing one of their largest operational costs — was locked inside a utility portal with no practical way to extract it at scale. Like many legacy systems, the portal was designed for occasional manual lookups, not for businesses that need to analyze data across 1,200+ meters.
Key Pain Points
- No API or data export — the only option was manual navigation, one meter at a time
- Meter inventory wasn't even visible in one place — you had to scroll through paginated lists
- 15-minute granular smart meter data existed but couldn't be extracted
- Monthly bills arrived as PDFs with no structured data, requiring hours of manual spreadsheet entry
- No way to correlate power data with other business systems for optimization insights
- Billing discrepancies went unnoticed without automated cross-referencing
Our Solution
We built an automated data pipeline that extracts data from the closed portal, normalizes it into a proper database, and delivers it through a reporting interface the client actually controls. Now their power data lives alongside their other business data, enabling real analysis and informed decisions.
Automated Data Extraction
We built a scheduled automation that reliably extracts all available data from the portal — consumption readings, billing records, meter inventory — without manual intervention. Runs daily and handles all the complexity of navigating the system.
Centralized Data Platform
All extracted data flows into a PostgreSQL database optimized for time-series analysis. 4+ million data points, properly structured and queryable. Now the client can join power data with their other operational data for insights that were previously impossible.
Self-Serve Reporting
A web-based reporting hub where the team can generate reports on demand, schedule automated email delivery, and export data for their own analysis. 9 different report types covering consumption, billing validation, and cost optimization.
Reliable Cloud Infrastructure
Fully hosted on AWS with auto-scaling via Elastic Beanstalk, automated monitoring, and high availability. The system runs itself — the client just uses the data.
The Results
Business Impact
- Complete visibility into power consumption across all 1,200+ meters
- Automated billing verification that catches discrepancies immediately
- Power factor optimization — identify issues, fix them, verify the results with data
- Before/after analysis for capital projects — prove ROI on equipment changes
- Data that integrates with other business systems for real operational insights
- Enterprise-grade platform at minimal cost (~$1,200 CAD/year hosting)
Technical Architecture
The platform runs fully automated — extracting data on schedule, normalizing it into a queryable database, and delivering reports without any manual intervention. The client gets fresh data every day and complete control over how they use it.
| Component | Technology |
|---|---|
| Web Scraping | OctoParse |
| Backend API | Express.js |
| Database | PostgreSQL (AWS Aurora) |
| ORM | Objection.js + Knex.js |
| Hosting | AWS Elastic Beanstalk (Auto-scaling) |
| Frontend | React (AWS Amplify) |
| File Storage | AWS S3 |
| Email Delivery | AWS SES |
| Scheduling | node-cron |
| Logging | Winston + CloudWatch |
Power is such a big part of our costs that if we find a way to really optimize it, that would be game-changing for the company.
Have a Similar Challenge?
We love tackling complex data problems. Let's talk about what you're working on.
Start a Conversation